FLTLVL is a flight planning app for general aviation (GA) pilots that answers one question before every flight: should I go, and if so, how? I designed it around that decision, then built it as a working demo on three recorded flights.
Role
Product designer and front-end developer
Timeline
Since January 2026
Team
Solo
Client
Self-initiated
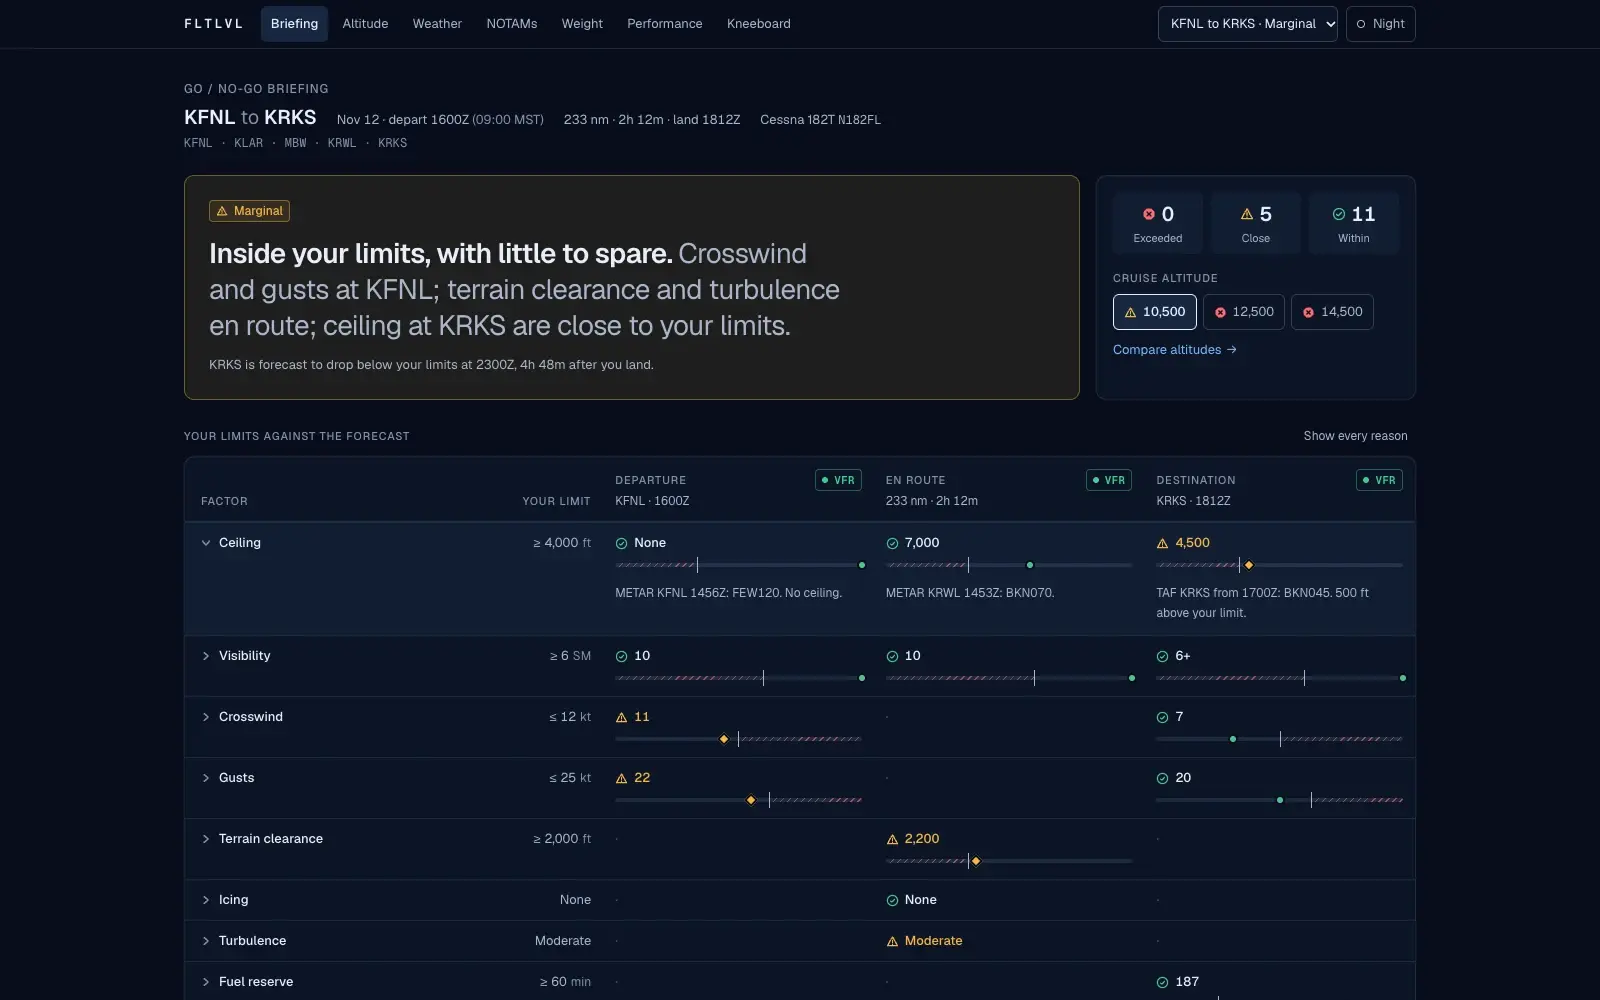
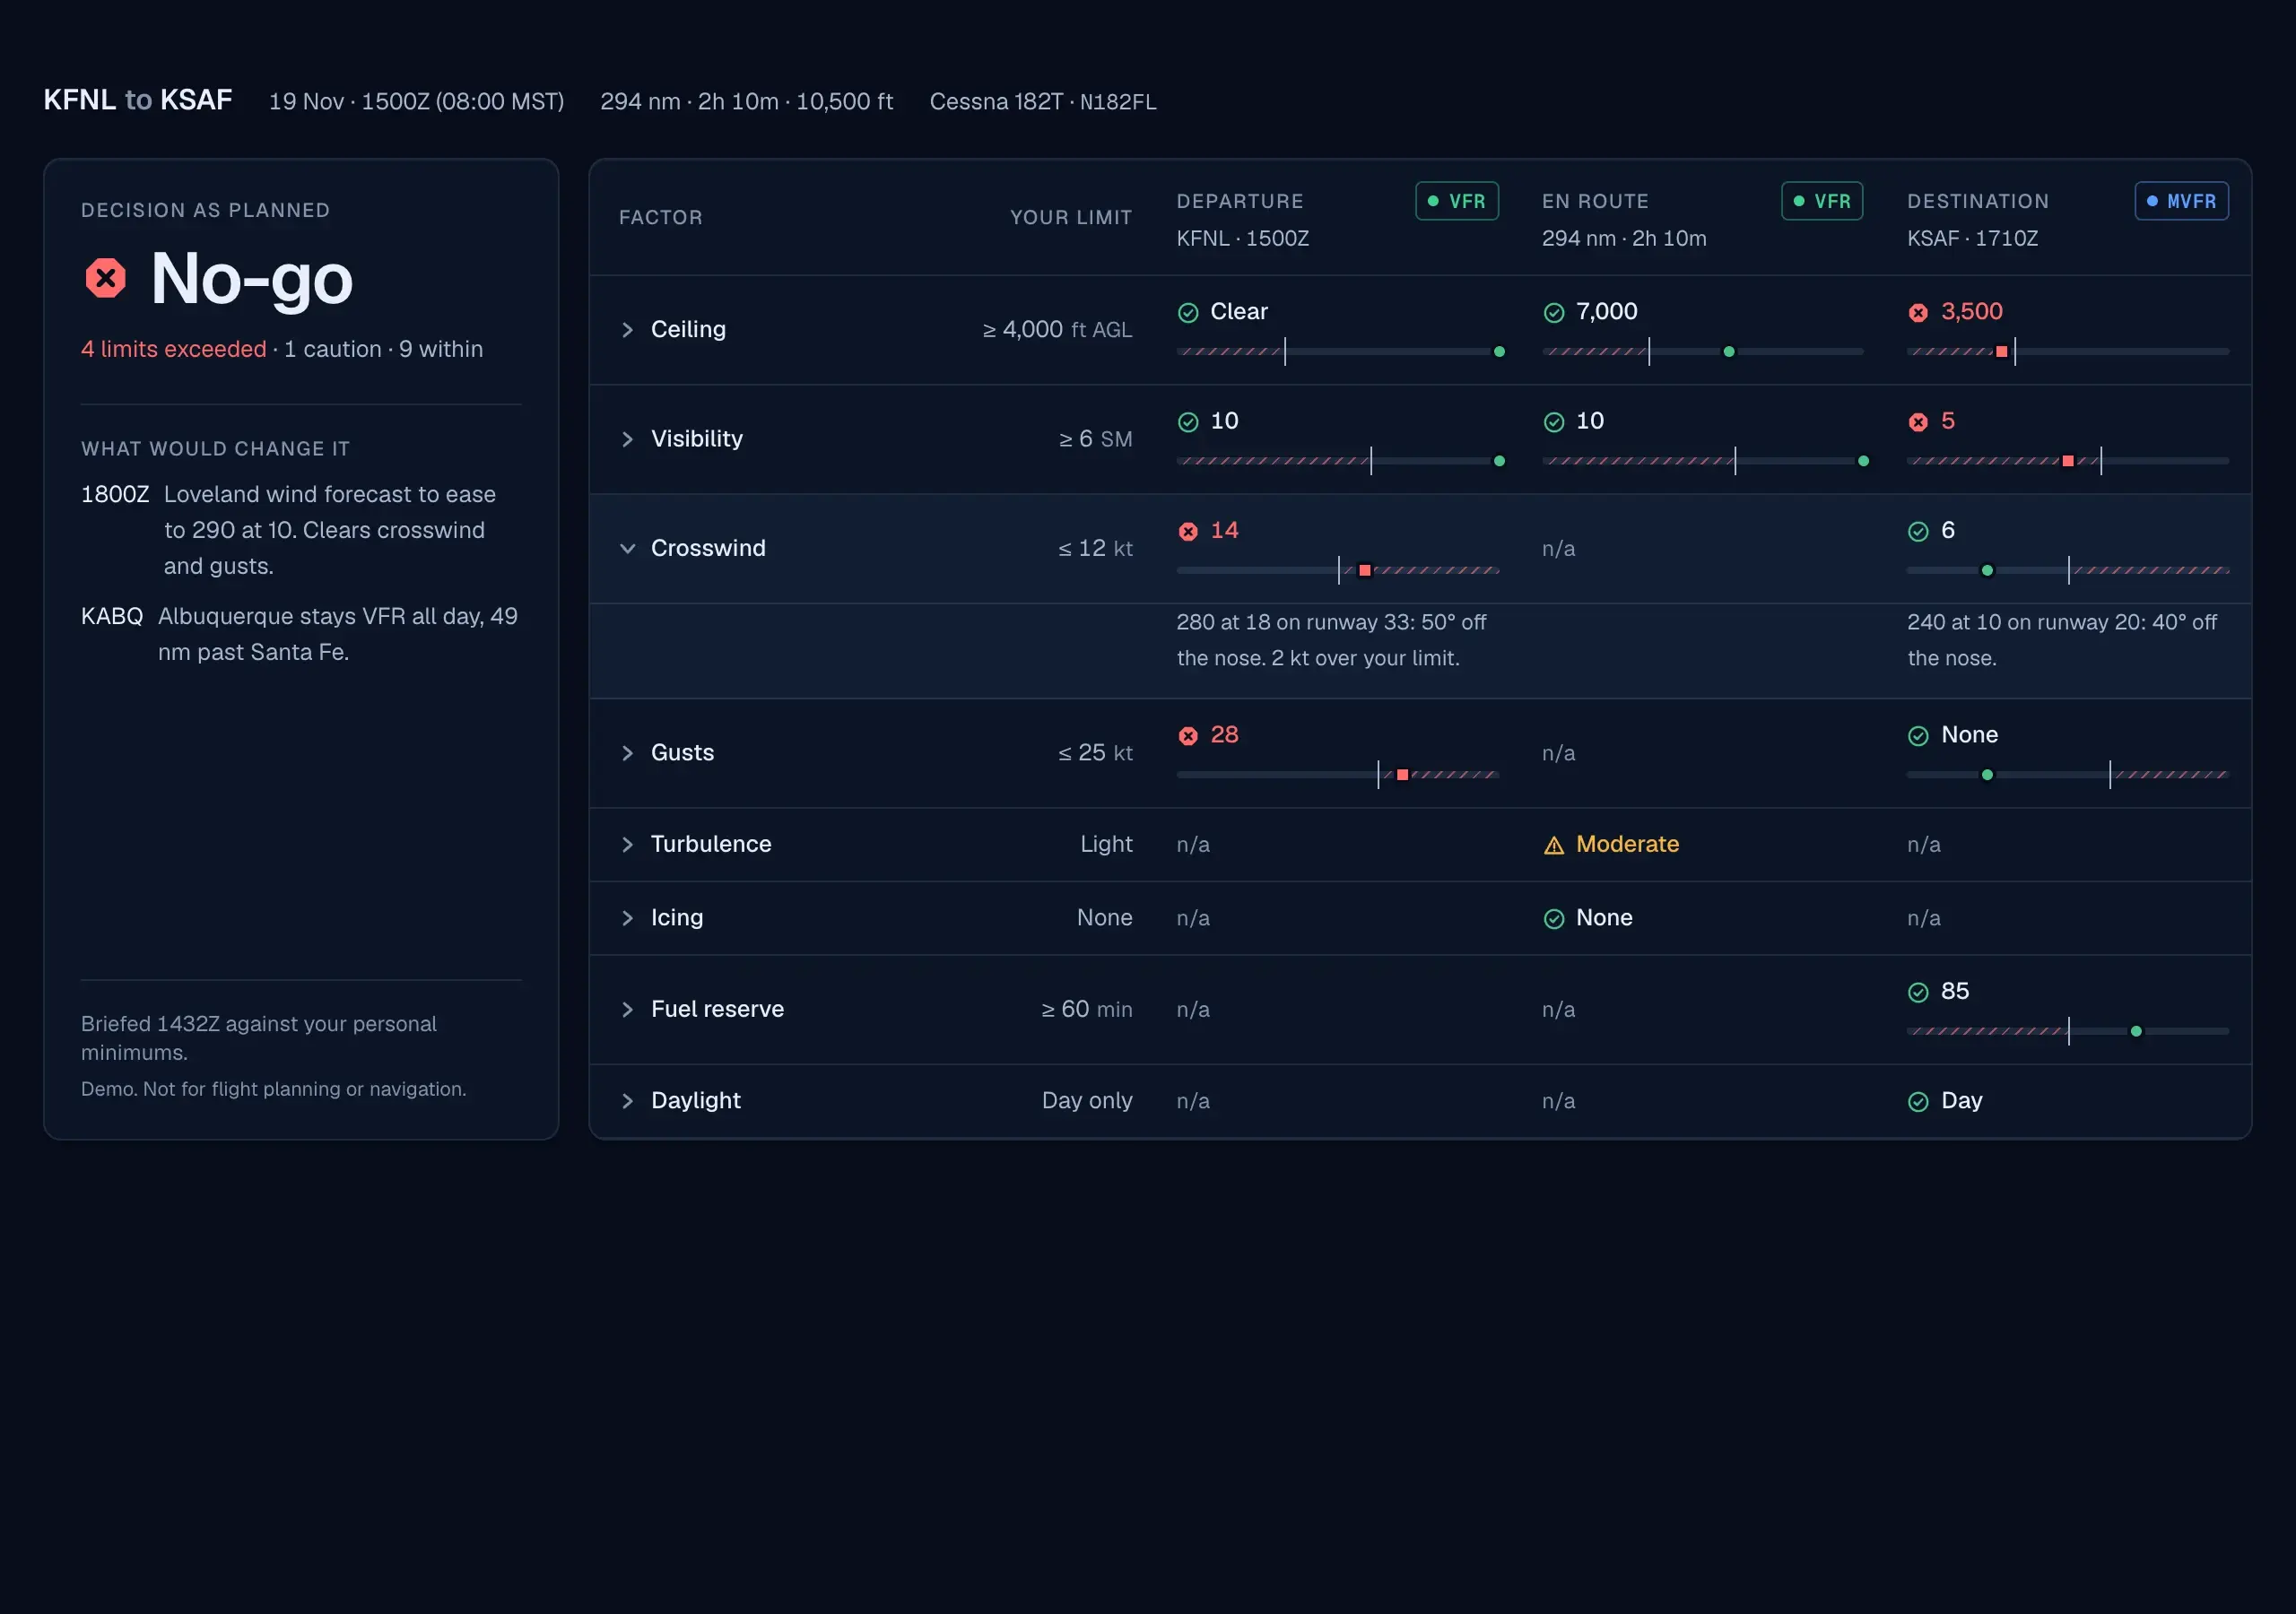
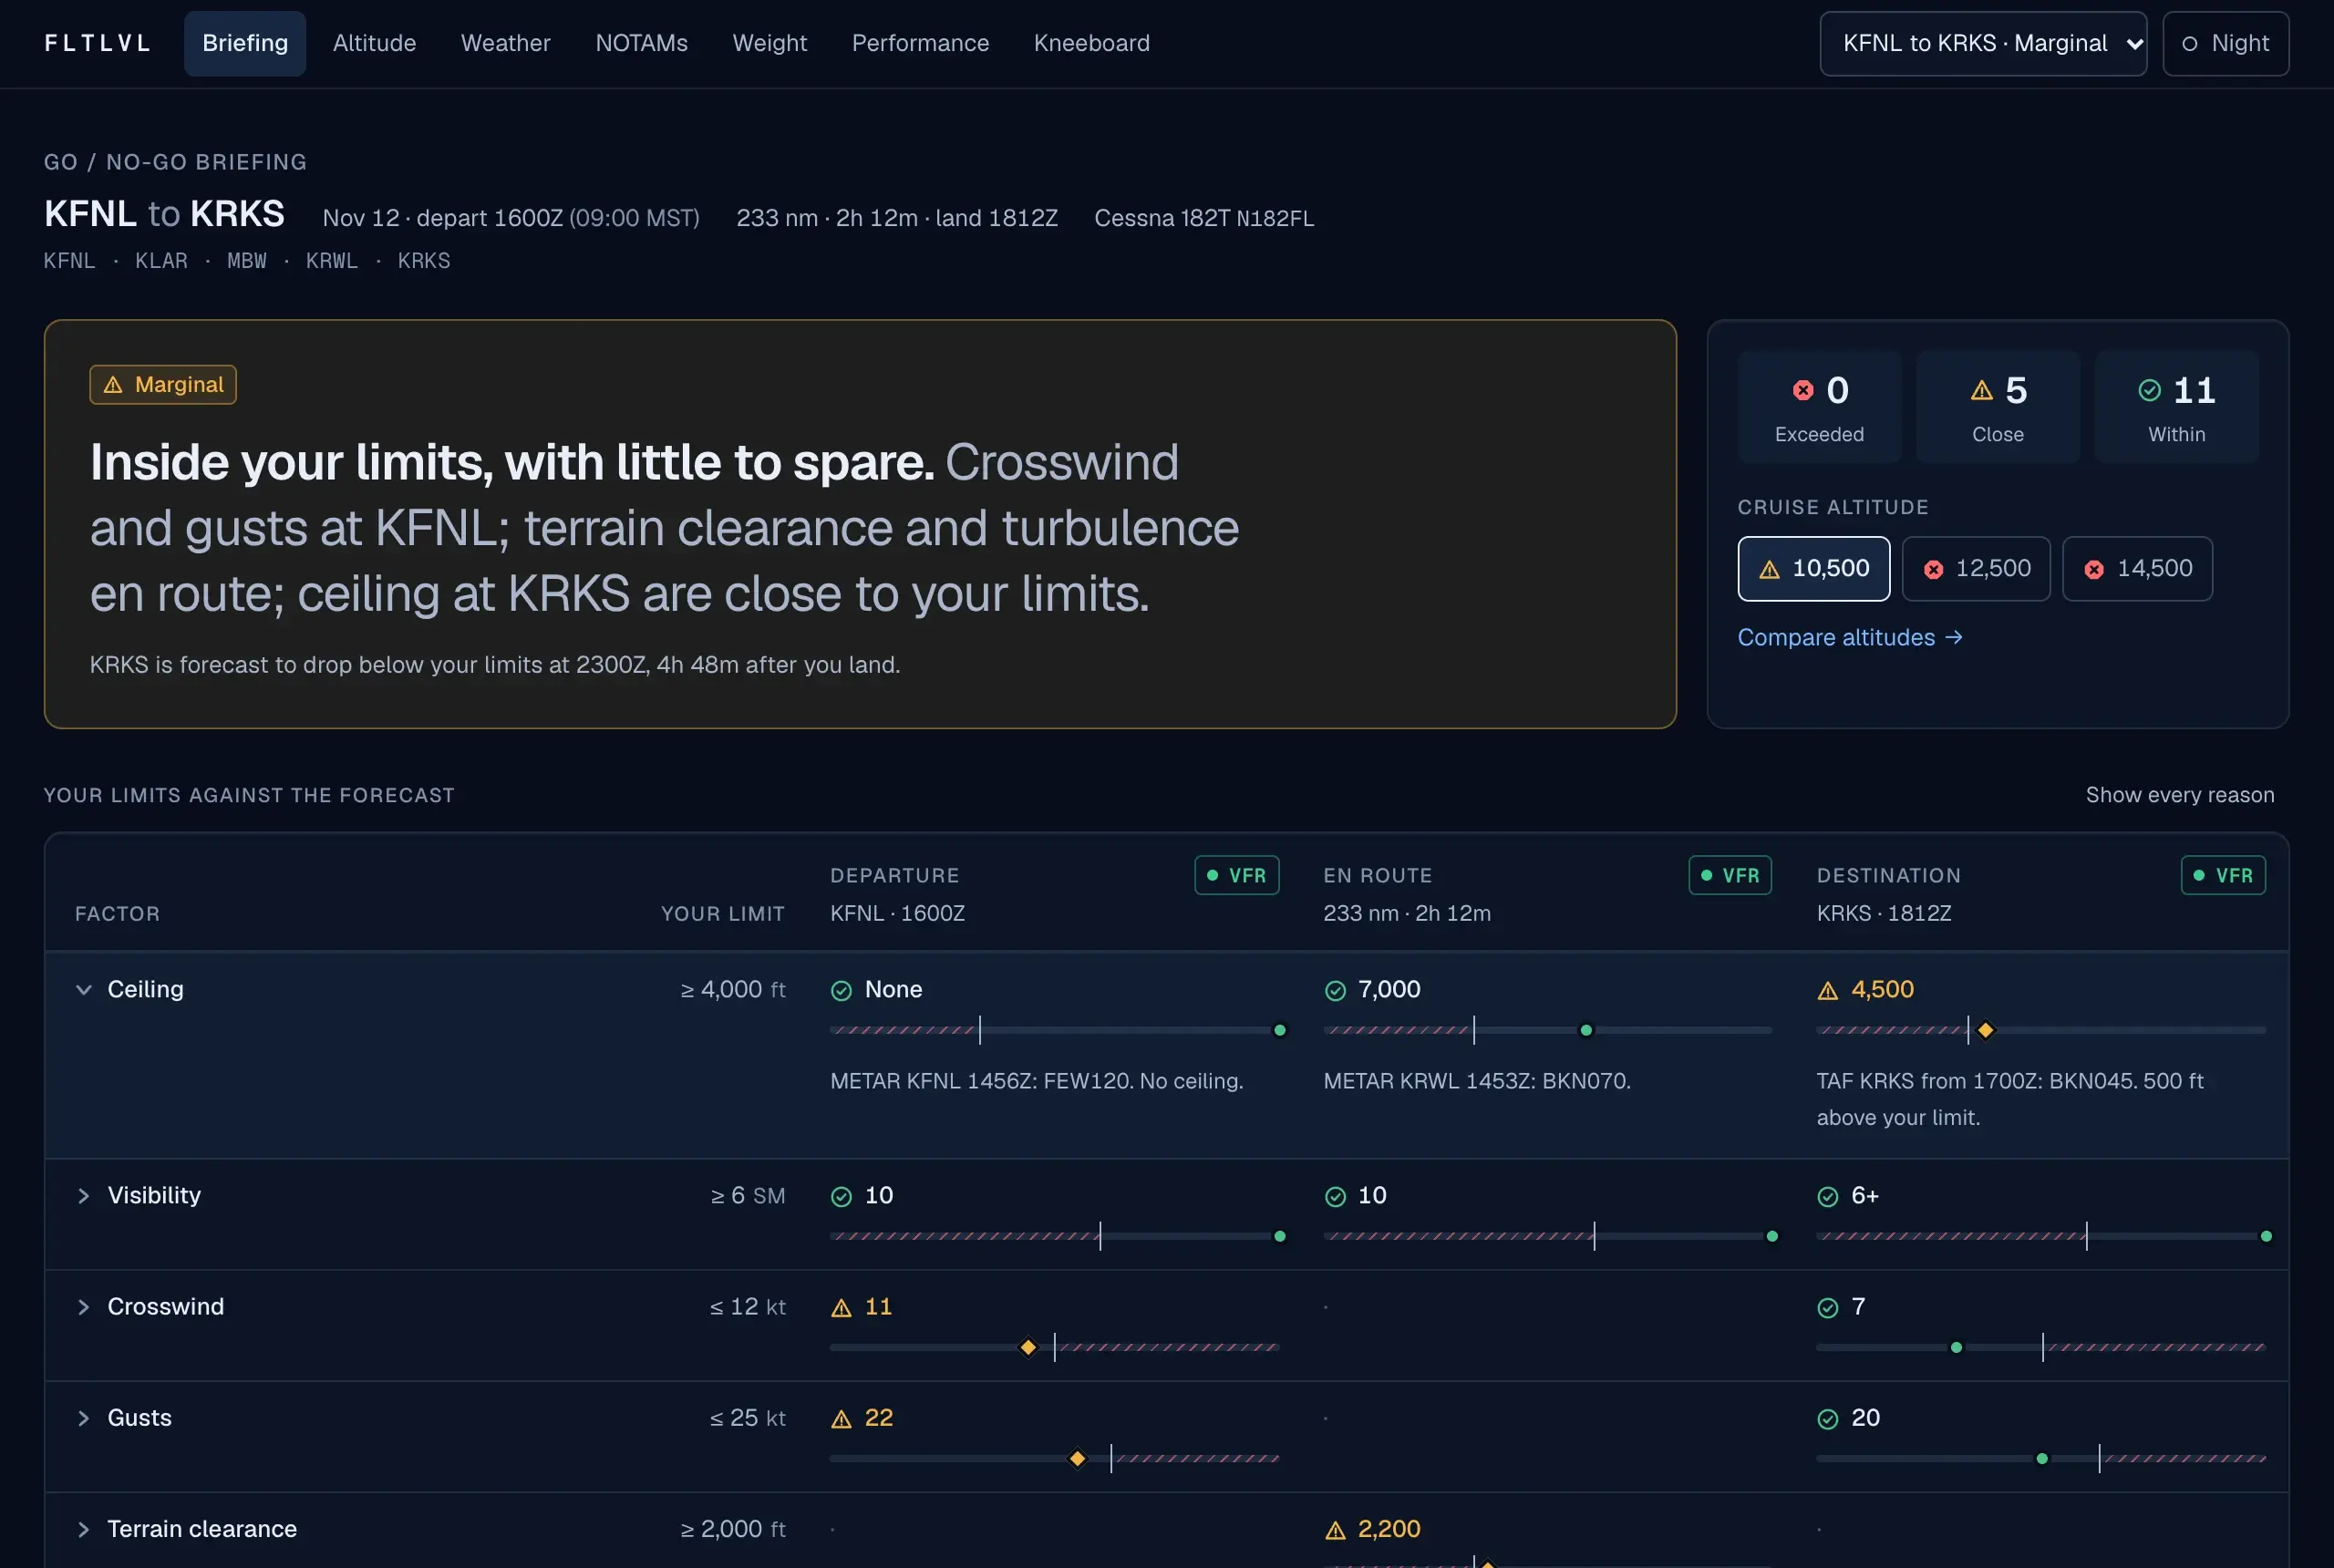
The home screen is the decision. A marginal day reads as a sentence first, then as every factor against the pilot's own limit, with the reason behind each number one tap away.
Try the working prototype
A working demo on recorded flights. Not for flight planning or navigation.
This is the deployed app, running on a marginal day from Colorado to Wyoming. Use the menu inside it to switch to the clean day or the storm.
Outcomes
7
Working screens
Briefing, altitude, weather, NOTAMs, weight and balance, performance, kneeboard
3
Recorded flights
A marginal day, a clean one, and a clear no-go, on one shared flight state
47
Hand-checkable tests
Each calculation is tested against a worked example
This is scope, not measured results. FLTLVL has had limited usability testing with a small internal group and has no usage numbers to report.
01 · Problem
Every preflight ends in one decision, and almost nothing in the tooling is organized around it. Weather lives in one place. Notices to Air Missions (NOTAMs) live in another. Weight and balance is a third, and performance is in the handbook. Each source is good at its own data. None of them knows what you, specifically, are willing to fly in.
I spent more than ten years as a Naval Aviator flying the P-3C and P-8A, and I teach as a civilian flight instructor. In both worlds the hard part was never reading a forecast. It was holding six answers in your head and comparing them against limits you set on a calmer day.
So the brief I wrote for myself was narrow. Put the pilot's own limits next to the forecast at departure, en route, and at the destination, and say plainly which ones are close.
02 · Discovery
I started in January 2026 by talking with pilots I knew from the Navy and from civilian flying, and by looking hard at my own habits. These were conversations between pilots about how a go or no-go call gets made, not a formal study.
What I took from them matched what I'd seen in the cockpit and the classroom. The call is rarely about one bad number. It's about several numbers that are each fine and, together, tight. A tool that only flags what's broken misses the flights that deserve the most thought.
The weather side mattered too. I minored in meteorology and used it constantly as a pilot, which is why the raw report stays on screen. Pilots read airport observations (METARs) and terminal forecasts (TAFs) in their coded form. A decode helps, but it shouldn't replace the text they trained on.
The same report, raw and decoded. This runs the app's own decoder. Switch reports and views:
An observation: what the airport is reporting now.
KEGE
Station KEGE
241650Z
24th of the month at 1650 Zulu
27012G20KT
Wind from 270° at 12 kt, gusting 20
1 1/2SM
Visibility 1 and 1/2 statute miles
-SN
Light snow
BR
Mist
OVC008
Overcast at 800 ft
M04/M06
Temperature -4 °C, dew point -6 °C
A2971
Altimeter 29.71 inHg
Demo reports written in the real format. Not current weather.
03 · Ideation
Project phases · select one
Frame the decision. Write down the one question a preflight has to answer, and the limits a pilot would judge it by.
The idea that organized everything was to make the decision the home screen. Not a dashboard of weather. A verdict, with every factor shown against its limit and the reason one tap away.
I mocked up three ways to do that on the same flight. One was a single table. One read the flight left to right, with a verdict for each place. One led with a plain sentence and folded away everything that was fine. I kept the table for the desktop because it shows the whole picture at once, and took the sentence from the third as the headline. The left-to-right version lost. It repeated every factor three times.
The second idea is in the name. Cruise altitude is the one variable a pilot controls that changes almost everything else: headwind, fuel, icing, terrain margin. It usually gets typed in as an input. I treated it as the question and gave it a profile view where terrain, cloud, icing, and the candidate altitudes share one picture.
I also added a third state between fine and not fine. Anything inside a limit but within 20 percent of it is marked close. That's where the marginal days live.
The three directions, as built for comparison. Pick one to see what happened to it:
Kept for desktop
One table, every factor against its limit at every phase. It shows the most at once and it is the closest to how a pilot scans a panel. This became the desktop briefing.
All three use an early placeholder flight, before the demo scenarios were written.
04 · Creation
I defined tokens before screens: a stepped navy for depth, one sans family with tabular numerals, and a monospace face for raw reports. Saturated color is reserved for flight categories and limit status, and it never appears alone. Within, close, and exceeded each get their own shape and word, so the screen still reads in the red night theme, where hue is gone.
The hardest screen was the altitude profile. It has to carry terrain, three kinds of weather, a freezing level, and several altitudes without turning into a weather map. Cloud is a soft fill, icing is hatched, turbulence is dotted, and the selected altitude is the only solid line. A headwind strip sits underneath on the same distance axis with a shared crosshair.
Every chart has a table behind it and a keyboard path through it. A slider moves the crosshair. Radio buttons choose the altitude.
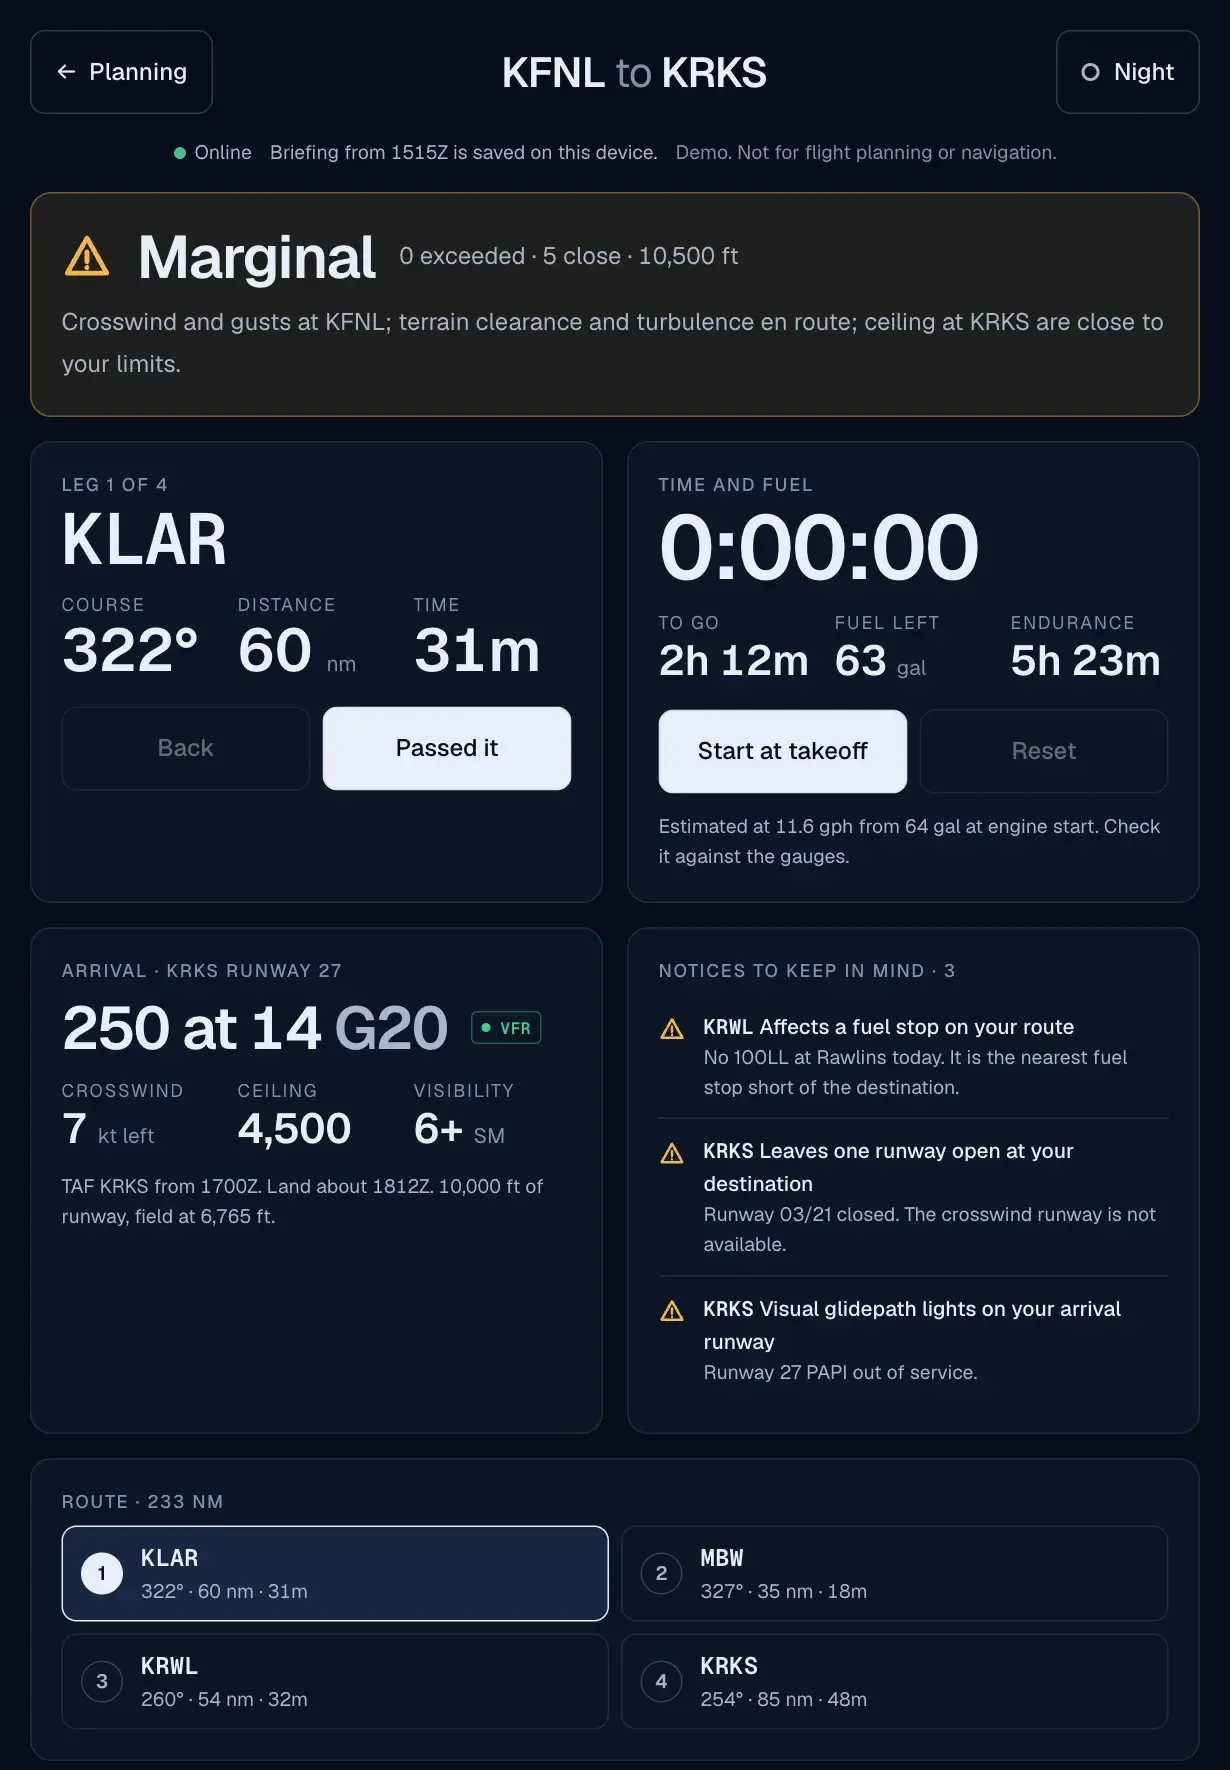
Kneeboard mode is the same flight rebuilt for a tablet on a yoke or a phone on a knee: the next leg, a timer, fuel, and the arrival, in targets big enough for a bumpy day.
I designed and built in parallel, with Claude Code writing the implementation against my direction. I set the rules: which flights the demo runs on, what counts as close, and what the verdict is allowed to say.
The decisions a screenshot can't explain. Pick a screen, then a marker or a question:
A score hides its reasons. The sentence names what is close and where, so a pilot can disagree with it.
A piece of the design system you can try. Drag the crosswind past the limit, then switch to Night:
Switch to Night and the hues collapse to red. The shapes and words still carry the meaning.
Kneeboard mode on a phone and a tablet, in both themes:
Night drops blue light and holds luminance low, for a dark cockpit.
Phone · scroll inside the frame
Tablet · two columns of tiles
The rest of the app, captured from the working demo:
Altitude optimizer · no-go
The storm flight. One candidate altitude is below the terrain, and all three sit in cloud and icing for the whole route. The screen says so in one line before the chart explains it.
Route weather timeline
Flight categories over time for each station, against the window you'd be in the air. Temporary conditions ride above the prevailing band, and the two instrument categories carry a hatch so they read without color.
NOTAM triage
Fifteen notices sorted into three tiers. Each one says why it landed where it did, so the pilot can trust what was folded away, and open it if they don't.
Weight and balance
The points move as the load changes. Outside the envelope, the marker becomes a crossed square, the outline goes dashed, and the headline states the problem in pounds or inches.
Performance
The whole runway as a bar, with ground roll, distance over a 50 foot obstacle, and a 50 percent margin drawn against it. Pick another runway and the wind components and distances follow.
05 · Moving to Production
The logic lives apart from the screens. Wind components, groundspeed, fuel, density altitude, and center of gravity are plain functions with 47 tests, each written as a worked example I can redo by hand on a flight computer.
All data comes through one typed adapter, so recorded scenarios and live sources are interchangeable. The demo runs on three hand-written flights: a marginal day, a clean one, and a clear no-go. Live mode pulls real METARs and TAFs from aviationweather.gov through a small proxy, because that service doesn't accept requests straight from a browser.
Live data stops there for now. The public winds aloft tables were retired this year and NOTAM access needs approval from the Federal Aviation Administration, so winds, terrain, and notices stay on recorded data, and the interface says so. Every screen carries the same label: demo, not for flight planning or navigation.
Testing so far is limited: a small internal group, plus scripted browser passes at four widths in both themes. It's deployed as a demo. A full accessibility audit and sessions with more pilots come next.
06 · Reflection
The verdict is a design decision, not a calculation. Deciding that close deserved its own state changed the product more than any chart did. The arithmetic was the easy part. Choosing what the app is allowed to say about it was the work.
Domain knowledge shows up in the sample data. The demo is only as believable as its flights. A pilot will forgive a rough edge in the interface long before they forgive a wind that makes no sense for the terrain.
Say what the data can't do. A planning tool that looks finished invites trust it hasn't earned. Labeling the demo, naming the rules of thumb, and showing which data is recorded cost almost nothing, and they keep the tool from overstating itself.